Hardware conditioning software
Legal stuff first. This is a completely free piece of software which we declare open source in compliance with GNU GPL license - which in essence means that one can use it as one wishes for whichever purpose (private or commercial) she or he wants.
As for machine/system parameters on which this program is to be run on, it's written in standard Tcl/Tk language v8.5 and doesn't require any additional libraries. If Tcl/Tk is already installed in your system, download only the
source code and use the interpretter to run it. Otherwise, download a much larger
32-bit Windows executable which in essence consists of the source core wrapped into the interpretter and run it as a standalone application. Both versions produce the same results.
The main application window screenshot is given below. This program presents itself as an interactive graph with some entry and result fields in it. Horisontal graph axis represents sensor temperature while vertical axis represents "raw" voltage found on the sensor i.e. at the noninverting amplifier input. Prior to calculating resistance and voltage values, a user should enter data into entry fields at the upper-left corner of the graph defining sensor type, Rb resistance, Tmin and Tmax temperatures, and Vbridge and Vadc_max voltages. After pressing the Enter key on the keyboard, the program automatically focuses onto the part of the graph in interest and plots Vsens voltage at available reference temperatures for which there are data given in sensor datasheets. Plotted green dots form a so called "transfer curve" of the measurement system. Current Rlin value is given in pink at the lower-right corner of the graph.
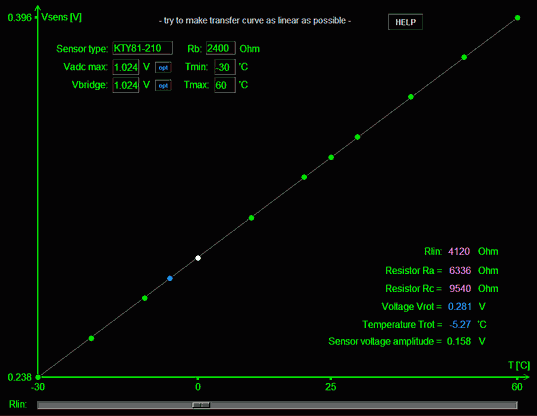
A diagonal line that dominates the interface enables visual estimation of sensor linaerity inside the given temperature range. Linearity depends solely on Rlin resistance, which can be changed by moving the horisontal slider button below the graph or by pressing left/right arrow keys on the keyboard. While the user changes Rlin value, program interactively recalculates values of Ra and Rc, and redraws the graph. The role of the circuit designer is to try to make the transfer curve as lineas as possible, which means to get the maximum number of green dots onto the straight diagonal line. For each sensor type and for each operating temperature range, there is a distinct optimal Rlin value to be found that produces maximum linearity.
As has been mentioned on the introductory page, it is amazing how linear KTYs can be made if the right Rlin value is selected. The only case in which this doesn't hold truth is if sensors are expected to operate at extreme (lower or upper) portions of their absolute temperature range, approximately below -30'C and/or above 120'C. The program provides an additional tool for estimating the maximum flatness region - the user can place and move a straight yelow line by clicking the left mouse button inside the graph area. This can be helpful if a compromise in terms of accuracy vs. linearity of the measurement system being designed is necessary to be made. The yellow line can be removed from and put back into the diagram by clicking the right mouse button.
The pale blue dot
"Raw" sensor voltage is calculated and presented along the vertical axis while the absolute raw sensor voltage amplitude is given at the bottom-right corner of the diagram. The application presents in pale blue color the two additional pieces of calculated data at the same diagram corner - the so designated rotation temperature Trot and rotation voltage Vrot. What are these vaues and what is their use? As has been explained on the previous page, the operational amplifier circuit amplifies the difference between DC voltages it observes at the noninverting and inverting inputs, and the amount of amplification can be set by choosing the value of the feedback resistor Rc - the higher the Rc resistance, the greater the amplification which means the higher the output circuit voltage at Tmax. If one visualises how changing Rc value changes the circuit output, it is not hard to figure out that it in effect rotates the straight output voltage line inside the plotted diagram around the temperature at which V- and V+ are equal. Since at that temperature (Trot) there is no voltage difference to amplify, Vout must be equal to V- and V+, no matter what the value of Rc; therefore, in terms of changing Rc, the point (Trot, Vrot) behaves as a fixed anchoring point. This special point is plotted in blue in the diagram.
To put the further cumbersome explanation aside, it can be stated that having all other variables fixed, Trot can take any value inside the operating temperature range depending solely on the relative ratio of Vbridge to Vadc_max voltages. By clicking on "Opt(imise)" buttons to the right of Vbridge and Vadc_max entry fields, the program provides the means of optimising either of these values versus the other so that Trot is set to precisely 0'C. Some simple A/D converters use fixed reference voltages which means that in that case Vbridge should be optimised; others accept various reference voltages which makes optimisation of either Vbridge or Vadc_max possible. In any case, setting Trot at 0'C leads to a very simple and convenient three step adjustment procedure of the actual circuit after it is built:
-
Disconnect Rc and adjust Ra value so that voltage at Op Amp inverting input is precisely equal to the calculated Vrot value. Please use a digital voltmeter with high input resistance for this one and the next step.
-
Put the sensor at precisely 0'C (for example by dipping it into the mixture of tap water and ice) and adjust Rlin value so that voltage at Op Amp noninverting input is equal to the calculated Vrot value.
-
Connect the Rc and put the sensor at some controlled reference temperature higher than 0'C inside the desired operating temperature range. Adjust the Rc value so that the temperature reading at the circuit output is correct. The boiling point of water (100'C) is a convenient temperature for this step if no trusted reference thermometer is at hand, but any other temperature is fine if there is one.
In order to provide for fine resistor value adjustments, it is wise to make approximately 9/10 of their calculated values out of fixed resistors, while the rest 1/10 should be made out of 1/2 of a trimming potentiometer. For example, if 5,2 kΩ is an ideal calculated value for a particular resistor, then one should connect 4,7 kΩ fixed resistor in series to 1 kΩ trimmer; we assume that the optimal value of the equivalent resistance will be found somewhere around the trimmer mid point, but there is also enough room to tweak it even if component tollerances are huge.
If everything is being done with enough care, the accuracy of 0.1'C can be achieved. This is much better than almost all commercially available digital temperature sensors with huge savings in money.